Corporate Report Graphics: How to Make Data and Content Clearer
An annual report or financial statement is not merely a mandatory, technical, or administrative document. It is also a communication tool: it recounts an organization's results, choices, numbers, responsibilities, prospects, and identity.
For this reason, annual report layout design should not be considered a final step to be tackled only when texts and tables are already finalized. Graphic design directly impacts how information is read, compared, and remembered.
This topic becomes even more evident in lengthy documents: annual reports, social impact reports, sustainability reports, institutional documents, and publications intended for members, investors, stakeholders, partners, and the community.
A Document That Builds Trust
Annual reports and financial statements serve a specific function: they must communicate complex information while maintaining authority. Readers expect precision, order, transparency, and continuity. Overly promotional graphics can seem out of place, while overly bare graphics can weaken the document's perceived quality.
The Financial Reporting Council, in presenting its report What Makes a Good Annual Report and Accounts, defines the annual report and accounts as a central element of corporate reporting, designed to offer investors and stakeholders clear, relevant information regarding a company's performance and prospects.
Layout design operates precisely on this balance. It must make the structure visible, distinguish levels of information, highlight key data, and maintain a tone consistent with the organization. It is not about making the financial statement "more creative," but rather building a more legible, solid, and credible document.
Layout Design as Editorial Architecture
A financial report often contains very diverse materials: institutional texts, financial data, tables, footnotes, photographs, charts, indicators, signatures, statements, technical chapters, and narrative sections. Without sound editorial architecture, everything risks carrying the same weight.
Designing the layout of an annual report serves to establish a clear hierarchy. Readers should immediately understand where they are, which sections are primary, where to look for data, which information introduces a chapter, and which details expand upon it.
An effective structure should include:
- a table of contents, section openings, and descriptive titles;
- clear hierarchies among body text, tables, charts, notes, and captions;
- rhythm between summary pages, technical pages, and narrative content.
This work also supports those who consult the document in a non-linear way. An annual report is not always read from cover to cover: it is often skimmed, used to verify a specific figure, shared in a meeting, cited in a presentation, or downloaded as a PDF. The graphic design must support all these use cases.
Cover, Table of Contents, and Chapter Openings
In institutional documents, the initial pages play a decisive role. The cover should not merely "dress up" the report: it must set the tone. It can be understated, photographic, typographic, more institutional, or more narrative, but it must clearly communicate that the document belongs to that specific organization and year.
The table of contents is another element that is frequently understated. In a long document, a well-designed table of contents is an essential orientation tool. It should allow readers to understand the overall structure, distinguish thematic areas, and quickly find specific sections.
Chapter openings, on the other hand, provide visual breathing room. They separate blocks of content, help alter the reading pace, and make a document that might otherwise appear as a continuous sequence of dense pages far more legible.
In projects of this type, Studio Polpo can develop editorial design projects capable of bringing order to financial statements, annual reports, and institutional documents, maintaining a balance among clarity, visual identity, and a professional tone.
Clear Texts, Not Just Attractive Pages
The authority of a financial report does not depend solely on numbers. It also depends on how texts are written and presented. Introductory letters, methodological notes, descriptions of results, organizational profiles, and commentary on data must be readable, not just accurate.
The SEC's Plain English Handbook was created to help companies and professionals make financial and disclosure documents clearer. Among its recurring recommendations are informative headings, direct phrasing, readable tables, sound page organization, and careful attention to how the reader moves through the document.
For an annual report, this means text and graphics must work together. A generic heading offers little guidance. An overly long paragraph slows reading speed. An important note placed in the wrong spot can get lost. When used effectively, a summary callout box can help readers enter a complex section without oversimplifying it.
Tables and Data: Order Before Decoration
In financial reporting, tables are often unavoidable. They do not always need to be converted into charts or infographics. Sometimes the best way to present data is a clean table with readable columns, aligned numbers, clear units of measurement, and easily traceable footnotes.
The quality of the layout shines through most notably here, where graphic design must be discreet yet precise. Excessive colors, lines, boxes, or symbols can make a page heavier rather than clearer. Conversely, a thoughtful use of spacing, alignment, and hierarchy makes even technical information easier to digest.
When designing data and tables, it pays to check:
- whether the reader immediately understands what they are viewing;
- whether numbers, percentages, and units of measurement are consistent;
- whether notes, sources, and comparisons are placed close to the data they reference.
The goal is not to make the document more dramatic. It is to simplify the comparison of information, preventing crucial data from getting lost inside overly dense pages.
Visual Identity and Continuity
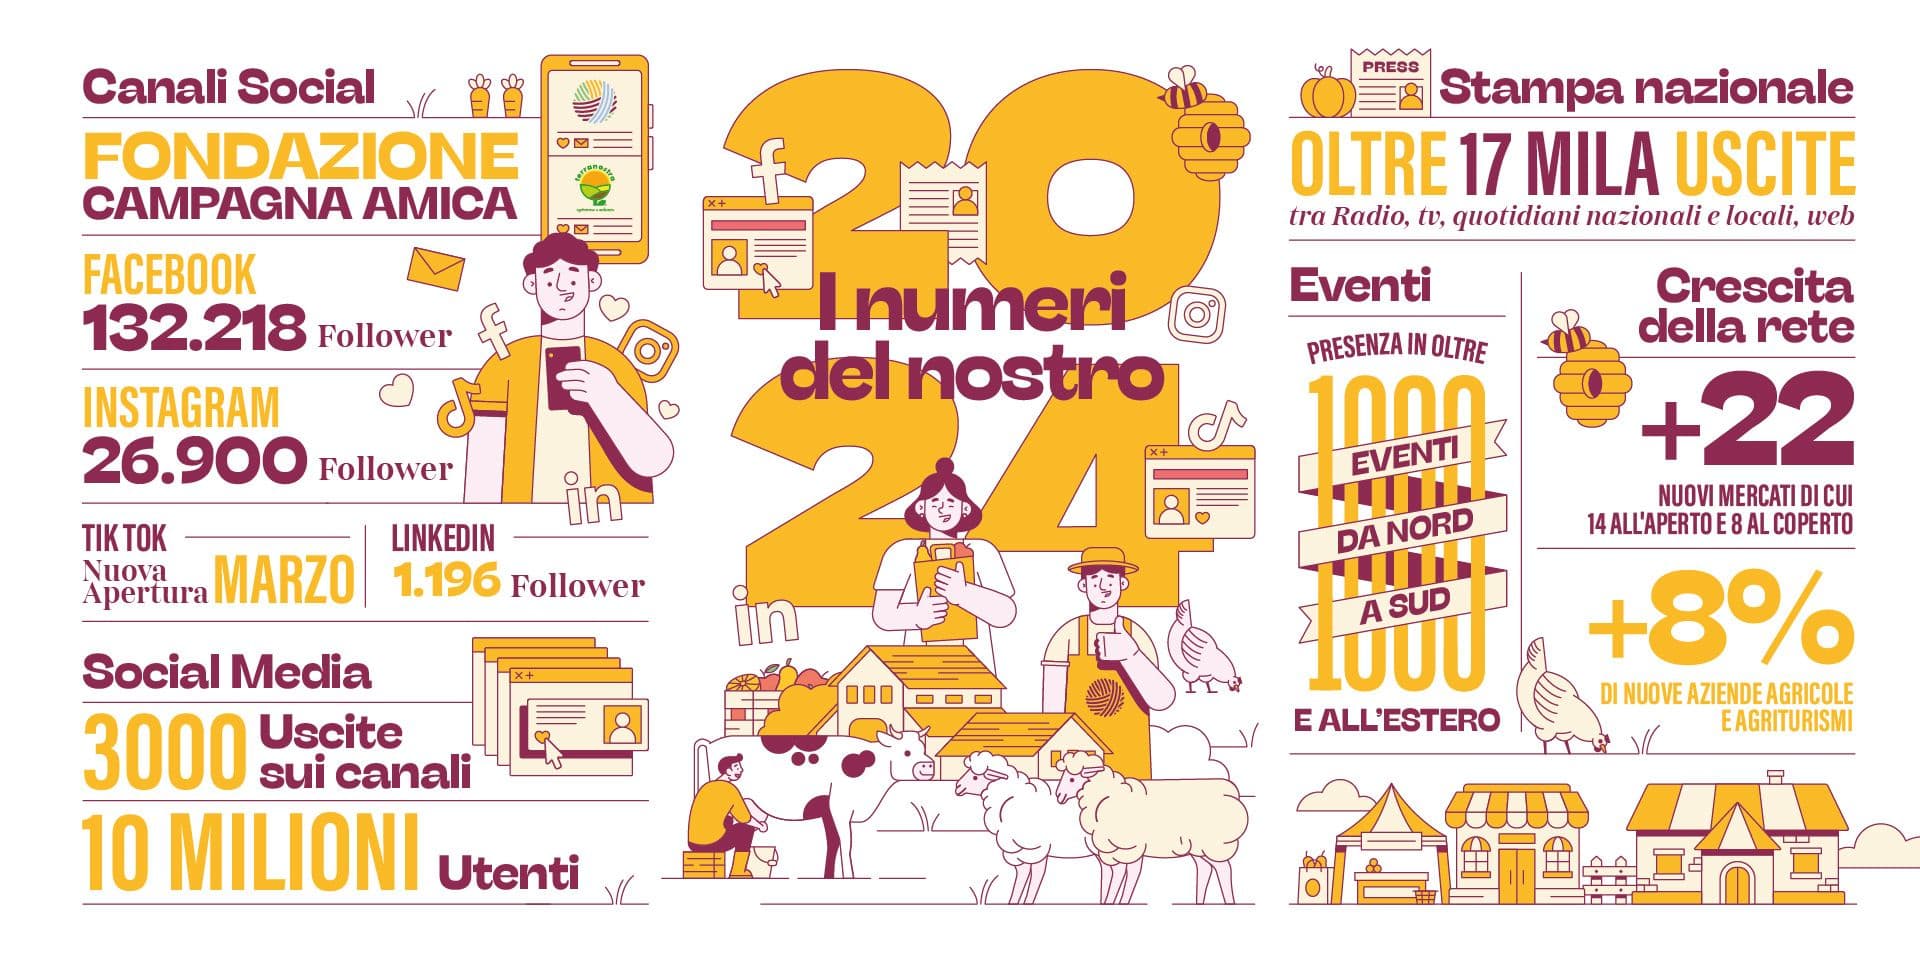
An annual report must be clear, but also recognizable. Colors, typography, logo usage, photography, icons, charts, and section treatments should connect to the organization's identity. This does not mean repeating the logo on every page, but rather establishing visual continuity.
Continuity is especially important for organizations that publish reports annually. Each financial statement must speak to its specific year while belonging to a broader story. A solid graphic framework can maintain stable elements while introducing variations: a new cover concept, an annual visual theme, a fresh approach to imagery, a secondary color palette, or an updated structure.
This approach avoids two opposite issues: on one hand, documents that look identical year after year and fail to show the organization's evolution; on the other, financial reports that completely alter their design language every year, losing brand recognition.
From Printed Document to Digital Formats
Annual reports and financial statements are increasingly read in digital formats: downloadable PDFs, web pages, attachments, presentations, newsletter excerpts, or materials tailored for different stakeholders. Layout design must accommodate these uses right from the beginning.
ESMA explains that the European Single Electronic Format (ESEF) requires annual financial reports to be prepared in XHTML, and when they contain IFRS consolidated financial statements, marked up with Inline XBRL. This combination allows human-readable presentation alongside machine-readable structured data.
Even when an organization is not subject to these mandatory requirements, the principle remains valuable: today's annual report must function as a document to be read, consulted, downloaded, shared, and archived. A page designed exclusively for print can be difficult to read on screen. A very wide table can become cumbersome in a PDF. An excessively heavy file size can complicate distribution.
The Most Frequent Errors
The most common errors in annual reports and financial statements occur when layout design is treated as a simple graphic application applied to pre-defined content.
Errors to avoid include:
- starting with the layout before clarifying the structure, chapters, and hierarchies;
- using graphics to decorate data and tables instead of making them more readable;
- designing only for the printed version while ignoring PDFs, digital platforms, and derivative materials.
Added to these is a more subtle mistake: confusing restraint with dullness. An institutional document can be measured without being anonymous. It can possess rhythm, identity, and graphic care while maintaining a serious, professional tone.
Conclusion
Professional layout design for annual reports and financial statements improves readability and authority because it transforms a complex set of information into an organized document. Titles, tables of contents, sections, tables, charts, notes, images, and white space create a pathway that helps readers grasp what truly matters.
A strong editorial design project does not alter the meaning of the data, but makes it clearer to read. It does not hide substance behind graphics, but supports it. It does not turn a financial report into a sales brochure, but gives it a more accessible, consistent, and professional form.
If you need to design an annual report, financial statement, sustainability report, or complex institutional document, you can contact Studio Polpo to create a clear, authoritative layout tailored for digital distribution or print.
FAQ
Why hire a professional to design an annual report layout?
Because an annual report contains a vast amount of complex information. A professional layout helps organize texts, data, tables, and sections, making the document more readable and authoritative.
Does a financial report have to be strictly understated?
No. It must be clear and professional, but it can still possess identity, rhythm, and graphic care. Being understated does not mean lacking visual design.
Is it better to design a financial report for print or digital formats?
It depends on the intended uses, but today it is best to design for both from the outset: print, PDF, on-screen viewing, online sharing, and potential derivative materials.


